Candlestick charts are the most important technical analysis tool in cryptocurrency trading. Whether you are buying Bitcoin or other tokens, learning to read candlestick charts helps you better assess price trends and time your trades. It sounds complex, but the basics are actually easy to grasp. Sign up on Binance and open any trading pair to see the candlestick chart.
What Is a Candlestick Chart
Candlestick charts originated in Japan over 200 years ago, initially used to analyze rice price movements. Each candlestick represents price movement over a specific time period and contains four key data points:
- Open price: The price at the start of the period
- Close price: The price at the end of the period
- High price: The highest price reached during the period
- Low price: The lowest price reached during the period
Basic Structure of a Candlestick
Each candlestick consists of a "body" and "wicks" (also called shadows).
The Body
The body is the thick bar in the middle of the candlestick. In the Binance App:
- Green (or red) body: The close price is higher than the open price, indicating a price increase -- called a "bullish candle"
- Red (or green) body: The close price is lower than the open price, indicating a price decrease -- called a "bearish candle"
Note: In the Binance App settings, you can choose between red-up/green-down (common in some Asian markets) or green-up/red-down (international convention).
The Wicks
The thin line extending above the body is the "upper wick," representing the high price. The thin line extending below the body is the "lower wick," representing the low price.
The longer the wick, the more the price pushed in that direction before pulling back.
Opening Candlestick Charts on the Binance App
Steps
- Open the Binance App and tap "Markets" at the bottom
- Find the trading pair you want to view, such as BTC/USDT
- Tap to enter the detail page
- The candlestick chart area is at the top of the page
- Rotate to landscape mode for a better viewing experience
Switching Time Frames
Above the candlestick chart, you will see a row of time options: 1m, 5m, 15m, 1h, 4h, 1D, 1W, etc.
- Scalpers/short-term traders: Use 1-minute to 15-minute candles
- Day traders: Use 1-hour and 4-hour candles
- Medium to long-term holders: Use daily and weekly candles
Download the Binance App for a smooth candlestick chart viewing experience.
Common Candlestick Patterns
Large Bullish Candle
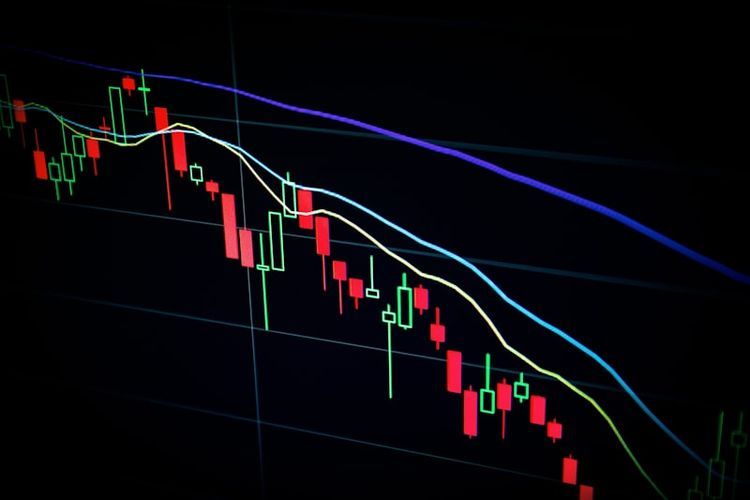
A long green candlestick indicates strong buying pressure and a significant price increase. If a large bullish candle appears after a downtrend, it may signal a trend reversal.
Large Bearish Candle
A long red candlestick indicates strong selling pressure and a significant price drop. If a large bearish candle appears after an uptrend, be cautious about potential risk.
Doji
The open and close prices are nearly identical, producing a very small body with relatively long upper and lower wicks. A doji represents equilibrium between buyers and sellers and is often a signal of a potential trend change.
Hammer
A candlestick with a long lower wick, a small body, and little or no upper wick. When it appears at the bottom of a downtrend, it may indicate an upcoming bounce.
Inverted Hammer (Shooting Star)
A candlestick with a long upper wick, a small body, and little or no lower wick. When it appears at the top of an uptrend, it may signal a pullback.
Additional Features on Binance Charts
Technical Indicators
Tap the "Indicators" button below the chart to add various technical indicators:
- MA (Moving Average): Shows the average price trend over a given period
- MACD: Gauges trend strength and direction
- RSI: Measures whether the price is overbought or oversold
- BOLL (Bollinger Bands): Displays the range of price volatility
Beginners should start with MA (Moving Average) -- it is the most fundamental and practical indicator.
Drawing Tools
In landscape mode, you can use drawing tools to add trend lines, support lines, and resistance lines to the chart to assist with price analysis.
Practical Tips for Reading Candlestick Charts
Start with Larger Time Frames
Look at daily and weekly charts first to identify the overall trend, then drill down to hourly charts for specific entry and exit points. When the overall trend is bullish, buying on dips has a higher success rate.
Pay Attention to Volume
The bar chart below the candlestick chart represents trading volume. When prices rise on increasing volume, the rally has strong capital support. When prices rise on declining volume, the rally may not be sustainable.
Do Not Rely on a Single Candle
A single candlestick does not tell you much. Look at multiple consecutive candles to judge the trend. Several bullish candles in a row indicate a strong uptrend; several bearish candles in a row indicate a clear downtrend.
Candlestick Analysis Is Not Infallible
Candlesticks and technical indicators are reference tools only. The crypto market is heavily influenced by news and events. Do not make trading decisions based solely on candlestick patterns. Sign up on Binance and spend time observing and learning -- building experience is essential.
FAQ
Can I change the candlestick color scheme on Binance?
Yes. Go to App Settings > Trade Settings > Candlestick Colors to switch between red-up/green-down and green-up/red-down.
Does viewing candlestick charts cost anything?
No. After you Download the Binance App, you can view candlestick charts and technical indicators for all trading pairs for free.
What time frame should beginners focus on?
Start with daily candles to understand a token's overall trend. Once you are comfortable, move to 4-hour and 1-hour candles.
Why do gaps sometimes appear in candlestick charts?
The crypto market trades 24/7, so gaps normally do not occur. If you see one, it is likely a data loading issue -- simply refresh the page.
Safety Tips
- Candlestick analysis is only a supplementary tool and does not guarantee trading profits
- Beginners should practice with small amounts and learn to read charts before increasing investments
- Do not blindly follow other people's candlestick-based trade calls
- Set proper stop-losses so that when technical analysis is wrong, losses are contained
- Spend time on the Binance App observing different tokens' price action to develop market intuition